This article is brought to you by Fibery 2.0:
Stop guessing what to build next. Join the Fibery 2.0 waitlist
If you've been let down by your product management software. If your feedback management system is used as a trash can by your colleagues. If you still have not integrated AI into your workflow. If you're still guessing what to build next. Join the Fibery 2.0 waitlist.
Productify readers automatically get on the top of the waitlist.
CEOs and other business leaders are now demanding more visibility into engineering productivity. They want to ensure the substantial investments in software development are paying off and that the engineering team is operating as efficiently as possible. Product Managers are also under constant pressure to deliver new features and functionality quickly and efficiently.
However, the software engineering community has long pushed back against simplistic attempts to quantify developer productivity. Many argue that the nature of software development, with its inherent complexity and collaborative nature, makes it very difficult to reduce to a few easily measurable metrics.
Today, we unbox this complexity and suggest some better ways to start measuring developer productivity at your company.
🚀Level up with Productify’s live courses:
1. Strategic Thinking for Product Managers (with O’Reilly)
2. Product Leadership (with O’Reilly)
3. Upcoming course with Maven on “Growing into Product Leadership” (July’24 Launch)
4. Live cohort course for Productify subscribers starting August’24.
Become a paid subscriber to get FREE access to Productify LIVE cohort and also receive discount links to courses with OReilly and Maven. Upgrade:
For collaborations, 1:1 mentorship, company speaker engagements and information on product trainings, email at ProductifyLabs@gmail.com
The problem with tracking engineering team activities
Most often, companies try to track common activity focused metrics to measure developer productivity. The key issue with these types of activity-based metrics is that they can incentivize the wrong behaviors, where developers focus on maximizing the metric rather than delivering meaningful, high-quality work that drives business outcomes.
These metrics are easy to game, and can lead to a culture of "busy work" rather than impactful contribution:
Lines of code added/deleted:
Developers can artificially inflate this metric by making unnecessary code changes or breaking up tasks into smaller commits.
This incentivizes quantity over quality and maintainability.
Number of pull requests opened:
Developers can create more, smaller pull requests instead of larger, more impactful ones.
This can make it seem like they are more productive, without necessarily delivering more value.
Number of code comments/reviews:
Developers may leave superficial comments or do perfunctory reviews just to meet a quota.
This does not necessarily translate to meaningful collaboration or code improvement.
Story points completed:
Developers can game this by breaking down tasks into smaller, easier-to-complete pieces.
This creates an illusion of productivity without considering the actual business impact.
Commits per pull request:
Developers may make more frequent, smaller commits to inflate this metric.
This can undermine code quality and make the development process less efficient.
McKinsey in their article “Yes, you can measure software developer productivity” (July 2023) came up with their own activity/output focused metrics which they called “Opportunity focused metrics”:
1. Inner/Outer Loop Time Spent:
This metric looks at the ratio of time developers spend on "inner loop" tasks (coding, building, testing) versus "outer loop" tasks (meetings, integration, deployment).
The goal is to incentivize developers to spend more time on the "inner loop" value-adding activities.

2. Developer Velocity Index (DVI) Benchmark:
This is a proprietary benchmark developed by McKinsey to assess a team's overall development velocity.
It aims to provide a holistic measure of a team's ability to deliver software quickly and efficiently.
3. Contribution Analysis:
This metric attempts to break down and analyze each individual developer's specific contributions to the team's overall output.
It uses data from tools like Jira to assess the relative impact of each developer.
4. Talent Capability Score:
This evaluates the skills, knowledge, and potential of individual developers.
The goal is to identify areas for upskilling and training to improve the overall talent pool.
These in-house developed recommendation from McKinsey have had its own share of critiques, such as the one from and (Article) which points out that the Mckinsey’s own custom metrics i.e “opportunity focused metrics” are too effort or output focused, far-fetched from DORA or SPACE metrics which are more impact and outcome focused:
Why is McKinsey adding ways to measure effort? One reason is that it’s the easiest thing to measure! But the McKinsey approach ignores an important truth: the act of measurement changes how developers work, as they try to “game” the system.
The need to move engineering close to product and business outcomes
An engineering team's view of productivity could change if they focused more on product and business outcomes by looking at reality of market and its customers.
Suppose an engineering team is tasked with building a new e-commerce feature for their company's website. In the past, the team may have measured their productivity solely based on activity-focused metrics like lines of code, pull requests merged, or story points completed. However, if the engineering team starts collaborating more closely with the product and business stakeholders, their perspective on productivity could shift significantly:
Instead of just focusing on delivering the feature quickly, the engineers would work with the product manager to deeply understand the business goals and customer needs behind the feature.
They would discuss metrics like conversion rates, average order value, and customer satisfaction - the actual outcomes that matter to the business. This would give the engineers a clearer sense of the impact they need to drive.
The engineers may realize that a more elegant, user-friendly design could have a bigger impact than just packing in more features. They may spend more time on UX refinement and testing to optimize for the desired business outcomes.
The team may also identify technical debt or architectural issues that could hamper future development and maintenance. They would then prioritize addressing these problems, even if it means slower short-term delivery, for the sake of long-term product health.
Engineers would participate in regular reviews with product and business stakeholders to get feedback, adjust priorities, and ensure alignment on key metrics and goals.
By taking this more collaborative, outcome-focused approach, the engineering team's definition of productivity would evolve. They would optimize not just for speed of delivery, but for the actual impact and value their work creates for the business and customers.
This shift in mindset can lead to better-designed, higher-quality software that truly moves the needle.
What kind of measurements make sense to understand developer productivity?
Eventually, organizations need a more holistic and balanced view of developer productivity, compared to just focusing on individual output or activity metrics.
Organizations need to recognize that productivity is multidimensional and requires measuring across multiple areas. Some frameworks have been developed to address the limitations of traditional approaches to measuring developer productivity, and provide a more comprehensive, data-driven way for organizations to assess and improve their engineering capabilities.
Here are three recommended frameworks to move towards measuring impact and outcome of software teams:
EEBO Metrics
Engineering Excellence to Business Outcomes developed by Thoughtworks, this framework aims to directly tie engineering work to tangible business results. Some examples:
1. Product Metrics:
-System uptime/availability
-Response time
-Error rates
-Customer satisfaction scores
2. Process Metrics:
-Deployment frequency
-Lead time for changes
-Change failure rate
-Mean time to recover (MTTR)
3. Progress Towards Desired Business Outcomes:
-User/customer satisfaction
-Time to market for new features
-Revenue growth
-Cost savings
DORA Metrics
The DORA metrics originated from a group of researchers who were trying to answer a key question: What makes the best-performing software engineering teams successful in delivering on business goals?
The researchers, who formed a startup called DevOps Research and Assessment (DORA), started by surveying companies that were practicing DevOps - the approach of bringing development and operations teams together.
1. Deployment Frequency (DF):
The number of successful deployments to production per day, week, or month.
This measures the velocity and agility of the software delivery process.
2. Lead Time for Changes (LT):
The time it takes for a code commit or change to be successfully deployed to production.
This reflects the efficiency and flow of the delivery pipeline.
3. Change Failure Rate (CFR):
The percentage of deployments that cause a failure in production, requiring a fix or rollback.
This indicates the reliability and quality of the changes being delivered.
4. Time to Restore Service (MTTR):
The time it takes to recover from a failed deployment and restore normal service.
This shows the team's ability to respond to and resolve production incidents quickly.
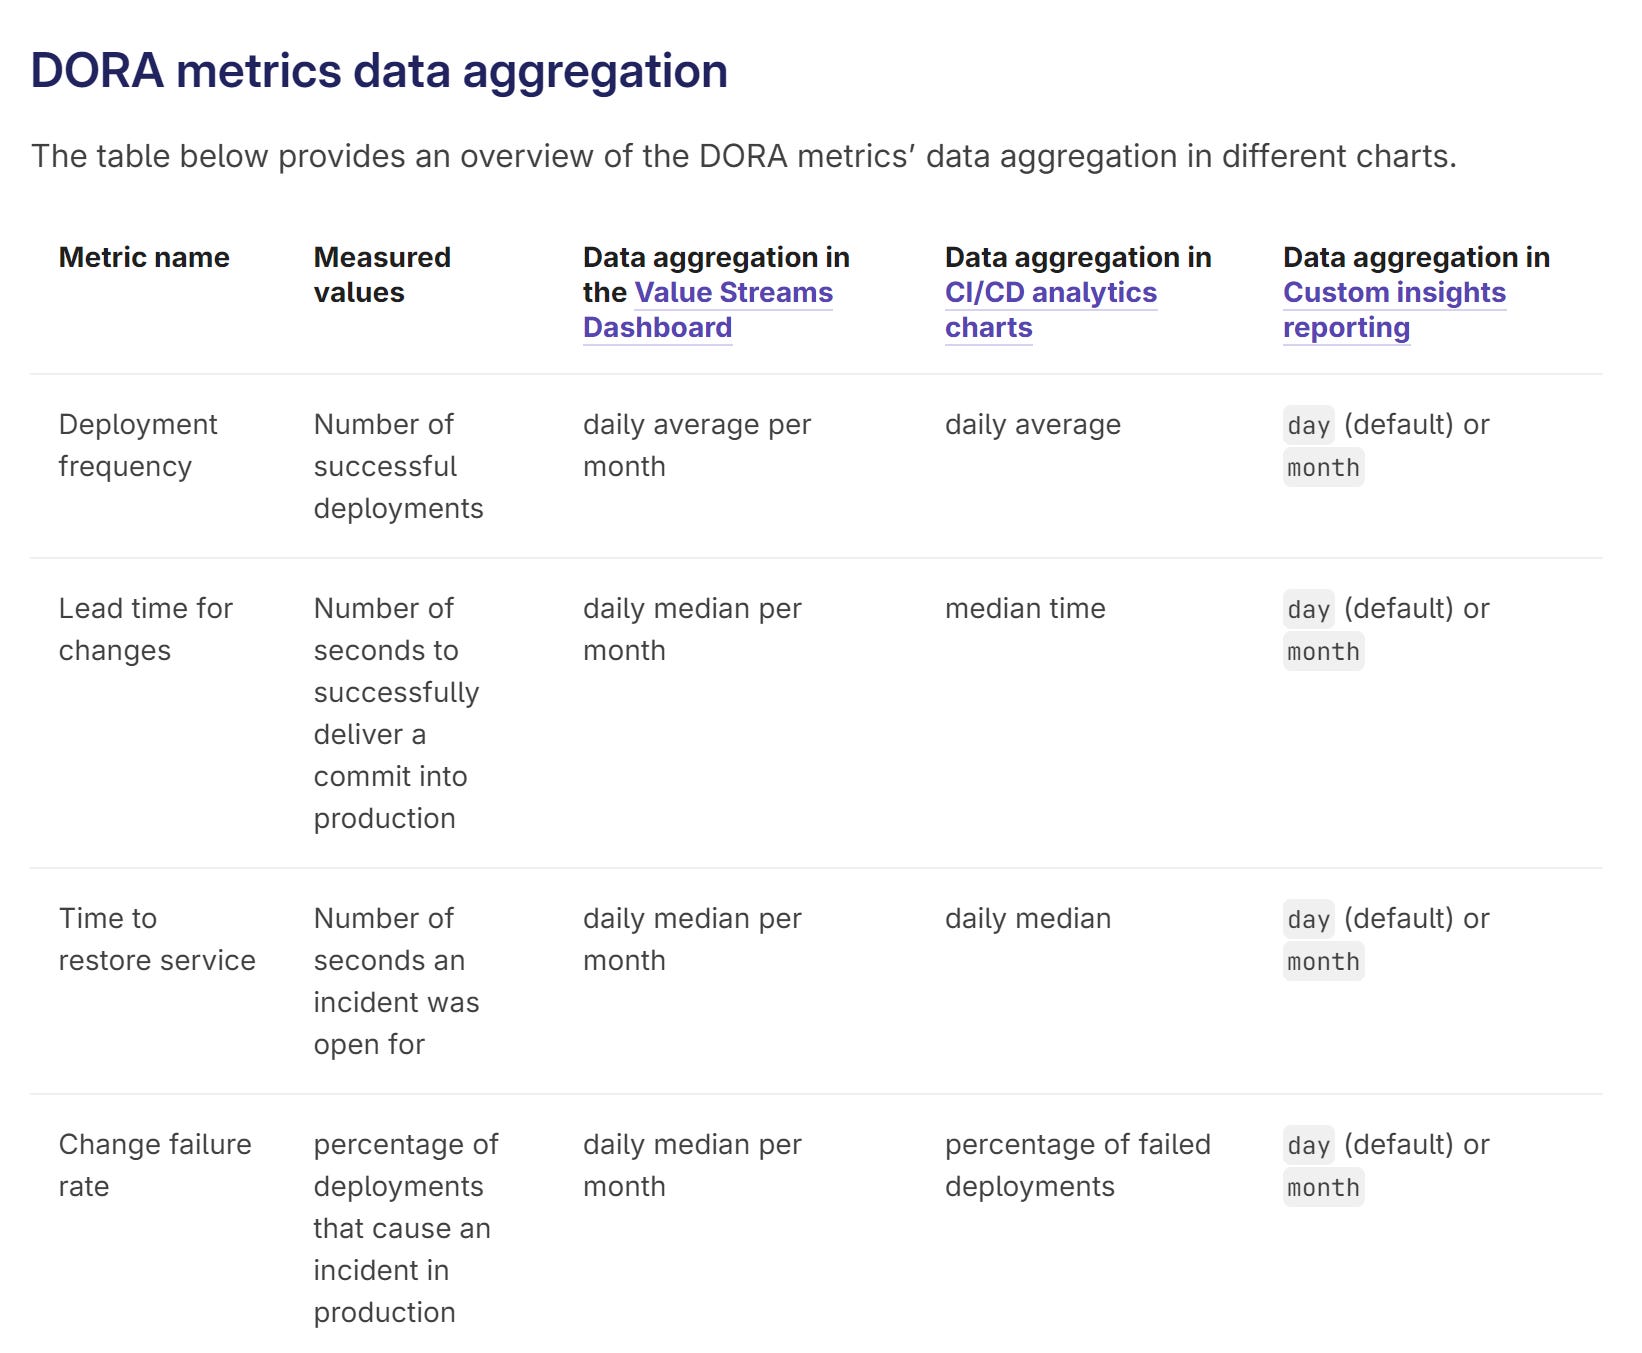
Source: Gitlab
SPACE Metrics
The SPACE framework was developed by research and strategy expert Nicole Forsgren, in collaboration with Microsoft and GitHub. The goal was to provide a more holistic and comprehensive approach to measuring developer productivity, beyond just traditional output-focused metrics.
1. Satisfaction and Well-being:
Measures developer satisfaction, work-life balance, burnout levels, and access to necessary tools/resources.
Helps understand the overall well-being and morale of the development team.
2. Performance:
Focuses on measuring outcomes and impact, rather than just output metrics like lines of code.
Looks at factors like feature delivery, quality, and customer/business impact.
3. Activity:
Tracks developer activities across the software development lifecycle.
Provides insights into things like time spent coding, in meetings, context switching, etc.
4. Collaboration and Communication:
Assesses how well the team is able to work together, share information, and coordinate.
Metrics could include things like code review quality, cross-team dependencies, and transparency.
5. Efficiency and Flow:
Measures the flow of work through the development process.
Looks at metrics like deployment frequency, lead time, and time to restore service (similar to DORA metrics).
Read more on SPACE metrics: The SPACE of Developer Productivity - ACM Queue
How to manage your CEO who wants to understand the investment in engineering?
The reality is engineering leaders cannot avoid the question of how to measure developer productivity, as CEOs and CFOs are increasingly frustrated by the lack of clear metrics compared to other business functions.
Instead of focusing on individual developer productivity metrics, which can be detrimental, the emphasis should be on measuring software development team enablement and overall outcomes of the team.
This involves understanding and improving the processes, working styles, technology, and culture that allow development teams to do their best work.
Some better approaches include:
Using metrics (deployment frequency, lead time for changes, time to restore service, change failure rate) as a foundation for experimentation and continuous improvement, rather than just raw productivity scores.
Measuring outcomes and impact, not just effort or output. This includes looking at things like customer satisfaction, business outcomes, and team collaboration.
Avoiding the risk of productivity scores creeping into performance reviews, which can distort the results.
Focusing on developer happiness, motivation, and enablement rather than just simple output metrics.
Communicating engineering priorities and challenges transparently to the CEO, rather than just throwing up hands and saying engineering is too complex to measure.
The key is to provide the CEO with the data and insights they want, but in a way that aligns with best practices for high-performing software teams, rather than a flawed productivity framework.
This requires striking a balance between accountability and empowering the engineering team