Welcome to this week’s edition of Productify. Before we get started on todays topic, did you know that:
only 12% of Product Management Professionals think that PMs solely drive their own strategy independent of senior leadership interference.
But >60% of them think strategy is driven mostly by Product Leaders (instead of PMs)
While 20% say it is the Business Leaders who drive Product Strategy
If you like such insights, and want tons of more. I am opening early access to Annual Product Strategy Survey - those of you who participate in this survey will get early access to all insights (talking about 30+ data points such as above) months before everyone else. Also I am giving away paid subscriptions to 5 lucky winners who full the survey. Participate in the survey through below link to get in:
Now onto today’s topic.
In a 2023 Survey of Product Management Profession by productfocus.com , 20% of respondents said they were measured by P&L success in their company and 33% by Revenue success.

Traditionally, Product Leaders were always contributing to P&L success, but necessarily not accountable. Accountability of P&L mostly lied with Business Unit Heads, CFO or CEO.
But now, 31% of CPOs (Chief Product Officers) are already accountable for P&L, and this will grow to 70% of CPOs by 2028 (CPO Insights Report, Products That Count).
CPOs are increasing becoming a partner to the CEO, taking away P&L Accountability and power from other C-Suite roles.
If you’re a product manager wanting to be a product leader in future, or are one already - this trend points to something:
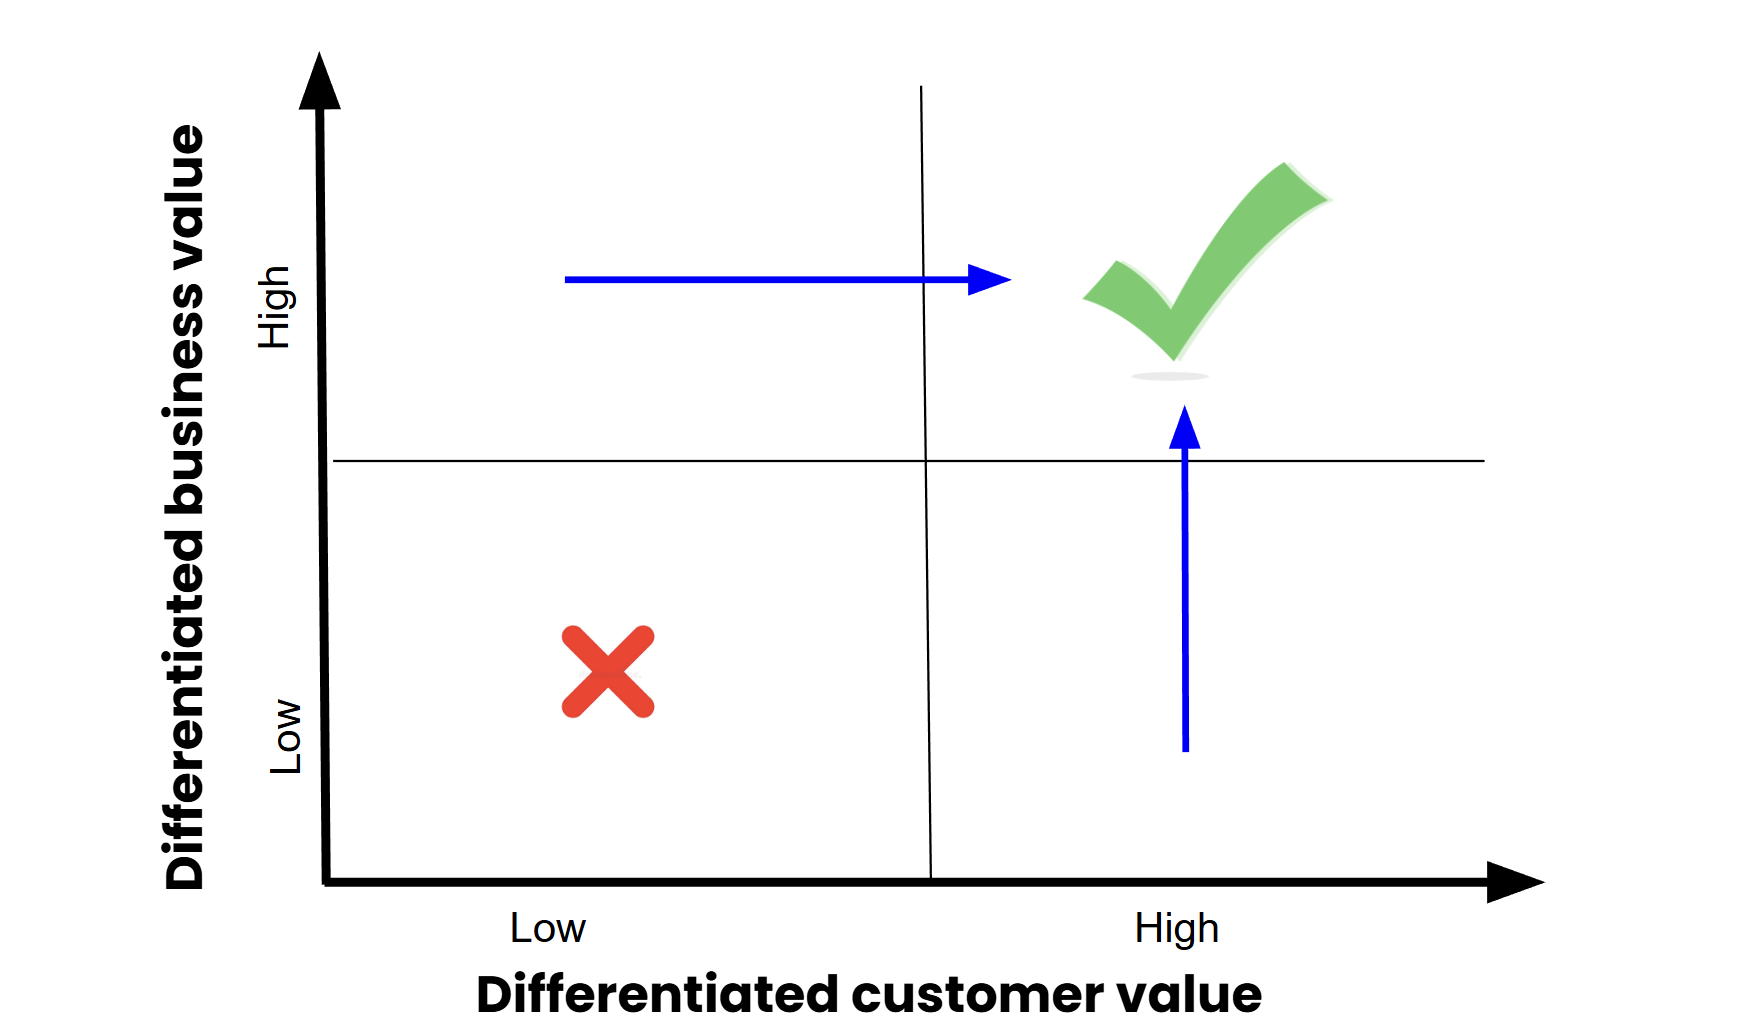
The need to balance customer value with business value.
Being in one of the two corners (only delving on customer value and not business value or vice versa) is not enough, and you need to motor your skills towards the top right corner where every decision you and your team takes needs to have customer value as north star but only if it comes with a bare minimum business value either in mid term or longterm (varies company to company)
So, what does it mean for you as Product Management professional, aiming to be in executive product positions in the future?
It is good to already foresee how CPOs are operating and their responsibilities for you to be prepared:
Setting financial targets: The CPO must work closely with the finance team to set clear revenue, cost, and profitability targets for the overall product portfolio as well as individual products/services.
Allocating resources: With P&L accountability, the CPO has to make decisions on how to allocate budget, headcount, and other resources across the different product teams to optimize financial performance.
Driving execution: The CPO must work to ensure effective execution towards the P&L goals. This includes monitoring key financial metrics, identifying issues, and course-correcting as needed.
Fostering a financial mindset: The CPO should instill a financial mindset across the product organization, helping product managers understand the commercial implications of their decisions.
Partnering with other leaders: To achieve P&L targets, the CPO must closely coordinate with the CFO, CRO (Chief Revenue Officer), and other business leaders. This ensures alignment on priorities and enables the CPO to access the necessary financial data and resources
Hence, it is a good first step for Product Managers of today to start combining product metrics with financial metrics and think of them as two sides of the same coin. I call it growth + financial impact duo. Growth here refers to all metrics you track around acquisition, engagement and retention, Financial part here refers to the impact on the P&L items - revenues, costs and all related margins. This Growth x Financial Impact duo is key to enhanced product thinking that combines customer success with that of business.
It is obvious and true that product metrics don’t move in isolation of financial impact, however, for many PMs - even at lead levels, the financial impact is not directly visible as it is led by someone much more senior.
Depending on the stage of your company, the product managers (at Senior or Group Level) should consider tracking both growth and financial metrics:
If your product is pre-Product Market Fit (PMF), it is still okay to not deep dive into P&L or financial yet - but important to know at what cost are your growing with conversion funnels, CAC and more:

If your product is past the PMF point (product-market fit point) and already in growth stage, it is important that as a Product Manager, you start considering Revenue and Profitability impact of your product and you may not be able to get an org. level view into financials but you can always maintain unit economics view of your own product in isoldation.

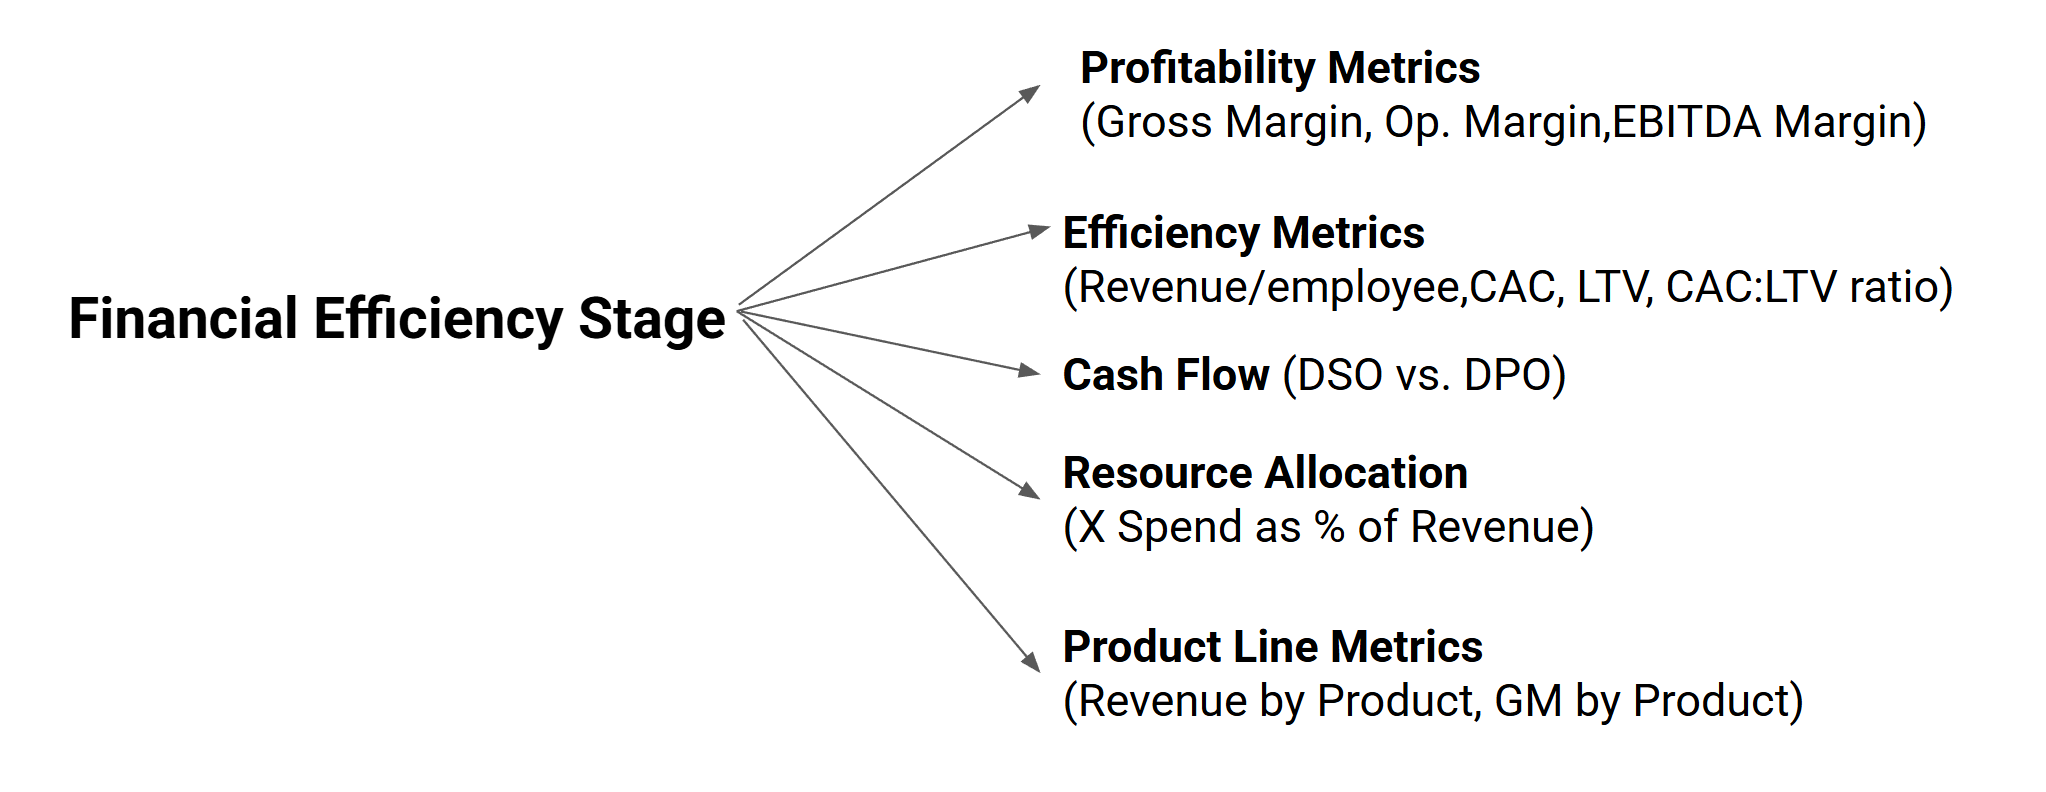
As companies grow bigger, they need not only sustained growth but also an efficient one. Hence, in such organizations it is important you look at efficiency of growth which is often about profitability, but also efficiency use of resources, cash flow management, spend allocations and product portfolio management.
The question is, as a Product Manager of Leader of a small product area - how do you build your own P&L view if you do not have access to company level P&L impact of your product.
Here is an exercise you can do to build unit economics of your own product.
Let us assume you’re a Product Manager who owns a product recommendation engine for an ecommerce platform. Their goal is to quantify how this feature impacts profitability at the transaction level.
Step 1: Define the Unit of Analysis
Identify the smallest measurable unit tied to your product’s value. For a recommendation engine:
Unit: Per transaction influenced by recommendations
Rationale: Recommendations directly drive purchases, and transaction-level data is trackable.
Step 2: Map Revenue Streams
Calculate incremental revenue generated by your product:
Baseline Revenue: Average order value (AOV) without recommendations (e.g., $50).
Incremental Revenue: AOV uplift from recommendations (e.g., +$5 per influenced transaction).
Attribution Rate: Percentage of transactions influenced by recommendations (e.g., 20% of 100,000 monthly transactions = 20,000 influenced transactions).
Revenue per Unit:
$5 (uplift)×20% (attribution)=$1 per influenced transaction
Step 3: Track Direct Costs
Direct costs are expenses directly attributable to the production, operation, or delivery of a specific product or service. For a Product Manager managing a software product, direct costs are those incurred specifically because the product exists and operates. These costs can often be tied to usage, infrastructure, or resources dedicated to the product.
Example: The recommendation engine cannot function without hosting infrastructure. If the product were shut down, these costs would no longer exist.
Write down costs directly tied to your product:
Cost Component - Monthly Cost - Cost per Unit (20,000 transactions)
Hosting (AWS) - $2,000 - $0.10
ML API fees - $1,500 - $0.075
Engineering support - $3,000 - $0.15
Total Direct Cost - $6,500- $0.325
Step 4: Calculate Gross Margin
Subtract direct costs from revenue per unit:
$1 (revenue)− $0.325 (cost)=$0.675 profit per influenced transaction
Step 5: Adjust for Variable Costs
Indirect but product-related costs are expenses that support the general operations of a business but cannot be directly traced to the production or delivery of a specific product. These costs are essential for running the business and indirectly contribute to the product's success, but they are not tied to individual units or transactions.
Examples of Indirect Costs
1. Operating Expenses
These are general business expenses that indirectly support your product:
Office Rent and Utilities: The cost of maintaining office space where teams work on various products, including yours.
Depreciation: Wear and tear on equipment used across multiple projects.
Indirect Labor: Salaries for operations managers or administrative staff who support the entire business.
2. Selling, General, and Administrative (SG&A) Expenses
These include broader expenses related to selling and managing the company:
Marketing and Advertising: Campaigns promoting the ecommerce platform that indirectly boost traffic to your recommendation engine.
Customer Support: Handling inquiries or complaints about recommended products.
Software Licenses: Tools used by teams working on multiple products.
3. Other Indirect Costs
Additional examples include:
Legal fees for contracts affecting multiple products.
IT infrastructure shared across departments (e.g., email servers).
Travel expenses incurred by employees working on general business activities.
Include indirect but product-related costs:
Customer support: $0.20 per influenced transaction (handling returns from recommended items).
Payment processing fees: $0.10 per transaction.
Adjusted Profit:
$0.675 − $0.30 = $0.375 per unit
Step 6: Model Scalability
Test how unit economics change with growth:
Scenario: 2x transactions (40,000/month).
Cost Impact: Hosting costs may scale sub-linearly
(e.g., $3,500 instead of $4,000), reducing cost per unit to $0.287.
New Profit: $1 - $0.287 - $0.30 = $0.413 per unit.
Step 7: Test how product metrics impact financial metrics
Track metrics that directly affect unit economics:
Recommendation click-through rate (CTR): A 1% drop in CTR could reduce influenced transactions by 10%.
Uplift sustainability: If AOV uplift falls to $3, profit per unit drops to $0.075.
Experiment and think more of how growth-financial impact duo works for you.
Step 8: Iterate for Improvement
A/B test algorithms to increase CTR or AOV uplift.
Renegotiate API contracts to reduce per-unit ML costs.
Collaborate with finance to validate attribution models and cost allocations.